Market Outlook
July 5, 2017
Market Cues
Domestic Indices
Chg (%)
(Pts)
(Close)
Indian markets are likely to open on a flat note tracking SGX Nifty and global
BSE Sensex
(0.0)
(12)
31,210
indices.
Nifty
(0.0)
(2)
9,613
US stock markets were closed on Tuesday on the occasion of July 4th, US
Mid Cap
(0.3)
(51)
14,759
Independence Day. Meanwhile North Korea launched another ballistic missile in the
Small Cap
(0.0)
(6)
15,567
direction of Japan, escalating standoff with the United States. The United States
Bankex
(0.3)
(66)
26,276
condemned the test-launch, firing warning missiles and vowing to hold the regime
accountable at the United Nations.
Global Indices
Chg (%)
(Pts)
(Close)
The U.K. stock markets ended the day in red as oil and mining stocks succumbed to
profit taking after sharp gains the previous day. The benchmark FTSE 100 closed
Dow Jones
0.6
130
21,479
down 0.3 percent at 7,357. European stocks fell slightly on Tuesday as fresh
Nasdaq
(0.5)
(30)
6,110
tensions on the Korean peninsula prompted traders to book profits after strong gains
FTSE
(0.3)
(20)
7,357
in the previous session.
Nikkei
(0.1)
(23)
20,032
Indian shares succumbed to profit taking on Tuesday as tension escalated in Korean
Hang Seng
(1.5)
(395)
25,389
peninsula. The benchmark BSE Sensex ended down 0.04 percent at 31,210 while
Shanghai Com
(0.4)
(13)
3,183
the broader Nifty index finished down 0.02 percent finishing at 9,613.
Advances / Declines
BSE
NSE
News Analysis
Advances
1,350
800
Sun Pharmaceutical signs agreement with Samsung Biologics for psoriasis drug
Declines
1,328
867
Detailed analysis on Pg2
Unchanged
133
82
Investor’s Ready Reckoner
Key Domestic & Global Indicators
Volumes (` Cr)
Stock Watch: Latest investment recommendations on 150+ stocks
BSE
3,840
Refer Pg6 onwards
NSE
21,918
Top Picks
CMP
Target
Upside
#Net Inflows (` Cr)
Net
Mtd
Ytd
Company
Sector
Rating
(`)
(`)
(%)
FII
1,455
3,940
55,908
Blue Star
Capital Goods
Buy
617
760
23.2
MFs
21
6,954
36,994
Dewan Housing FinanceFinancials
Buy
436
520
19.3
Mahindra Lifespace
Real Estate
Buy
447
522
16.9
Navkar Corporation
Others
Buy
206
265
28.8
Top Gainers
Price (`)
Chg (%)
KEI Industries
Capital Goods
Accumulate
232
258
11.0
Unitech
6
5.0
More Top Picks on Pg3
Videoind
23
4.8
Key Upcoming Events
Bataindia
574
4.5
Previous
Consensus
Date
Region
Event Description
Reading
Expectations
Intellect
132
4.3
Jul 5, 2017
Germany PMI Services
53.70
53.70
Gdl
271
3.9
Jul 6, 2017
US
Initial Jobless claims
244.00
243.00
Jul 7, 2017
US
Change in Nonfarm payrolls
138.00
177.00
Top Losers
Price (`)
Chg (%)
Jul 7, 2017
UK
Industrial Production (YoY)
(0.80)
0.20
Religare
157
(6.6)
Jul 7, 2017
US
Unnemployment rate
4.30
4.30
More Events on Pg4
Jpassociat
19
(6.3)
Gvkpil
8
(5.4)
Gmrinfra
19
(5.1)
Justdial
363
(4.9)
#as on 4t July, 2017
Market Outlook
July 5, 2017
News Analysis
Sun Pharmaceutical signs agreement with Samsung Biologics for
psoriasis drug
Sun Pharma has entered into a long-term manufacturing agreement with globally
renowned Contract Manufacturing Organization (CMO) Samsung Biologics for a
plaque psoriasis drug Tildrakizumab. The contract is valued at $55.5 million.
Sun Pharma had acquired rights to market Tildrakizumab in the US and Canada
in 2014 from MSD. Sun Pharma is responsible for activities such as regulatory
submission, pharmacovigilance, post approval studies, manufacturing and
commercialization of the product. Sun Pharma later sold its rights to market the
drug in Europe to Spanish company Almirall.
The company has indicated that it has plans to launch Tildrakizumab in the US in
the beginning of FY19. Tildrakizumab is Sun Pharma’s entry into the innovation
drug segment.
We believe that this is a next logical step towards commercialization of the
innovative drug and it should help Sun Pharma to enter in the market of
innovation drug commercialization.
Economic and Political News
China says Doklam situation ‘grave’, rules out compromise with India
Bond yields continue to stay high as market fears further OMO sales
Narendra Modi’s Israel visit sign of India’s shifting foreign policy calculus
RBI releases Rs 2,400 crore for Telangana, farmers to gain
North Korea Launches Its Longest-range Ballistic Missile
Corporate News
NTPC bets $10 billion on coal power despite surplus, green concerns
Jyoti Structures becomes first case to be admitted for bankruptcy proceedings
ICICI Prudential to take over Sahara Life’s insurance business
Textile industry size to touch $250 billion in 2 years, says official
Market Outlook
July 5, 2017
Top Picks HHHHH
Market Cap
CMP
Target
Upside
Company
Rationale
(` Cr)
(`)
(`)
(%)
Strong growth in domestic business due to its leadership
in acute therapeutic segment. Alkem expects to launch
Alkem Laboratories
21,953
1,836
2,161
17.7
more products in USA, which bodes for its international
business.
We expect the company would report strong profitability
Asian Granito
1,352
449
480
6.8
owing to better product mix, higher B2C sales and
amalgamation synergy.
Favourable outlook for the AC industry to augur well for
Cooling products business which is out pacing the market
Blue Star
5,899
617
760
23.2
growth. EMPPAC division's profitability to improve once
operating environment turns around.
With a focus on the low and medium income (LMI)
consumer segment, the company has increased its
Dewan Housing Finance
13,669
436
520
19.3
presence in tier-II & III cities where the growth opportunity
is immense.
Loan growth is likely to pick up after a sluggish FY17.
Karur Vysya Bank
8,735
145
160
10.7
Lower credit cost will help in strong bottomline growth.
Increasing share of CASA will help in NIM improvement.
Economic recovery to have favourable impact on
advertising & circulation revenue growth. Further, the
Jagran Prakashan
6,069
186
225
21.2
acquisition of a radio business (Radio City) would also
boost the company's revenue growth.
High order book execution in EPC segment, rising B2C
KEI Industries
1,808
232
258
11.0
sales and higher exports to boost the revenues and
profitability
Speedier execution and speedier sales, strong revenue
Mahindra Lifespace
2,292
447
522
16.9
visibilty in short-to-long run, attractive valuations
Massive capacity expansion along with rail advantage at
Navkar Corporation
2,935
206
265
28.8
ICD as well CFS augurs well for the company
Strong brands and distribution network would boost
Siyaram Silk Mills
2,002
2,136
2,500
17.0
growth going ahead. Stock currently trades at an
inexpensive valuation.
Market leadership in Hindi news genre and no.
2
viewership ranking in English news genre, exit from the
TV Today Network
1,399
235
344
46.7
radio business, and anticipated growth in ad spends by
corporates to benefit the stock.
Source: Company, Angel Research,
Market Outlook
July 5, 2017
Key Upcoming Events
Global economic events release calendar
Bloomberg Data
Date
Time
Country
Event Description
Unit
Period
Last Reported
Estimated
Jul 05, 2017
1:25 PMGermany
PMI Services
Value
Jun F
53.70
53.70
Jul 06, 2017
6:00 PMUS
Initial Jobless claims
Thousands
Jul 1
244.00
243.00
Jul 07, 2017
6:00 PMUS
Change in Nonfarm payrolls
Thousands
Jun
138.00
177.00
2:00 PMUK
Industrial Production (YoY)
% Change
May
(0.80)
0.20
6:00 PMUS
Unnemployment rate
%
Jun
4.30
4.30
Jul 10, 2017
5:30 PMIndia
Industrial Production YoY
% Change
May
3.10
Jul 12, 2017
7:00 AMChina
Consumer Price Index (YoY)
% Change
Jun
1.50
1.50
2:00 PMUK
Jobless claims change
% Change
Jun
7.30
Jul 13, 2017
US
Producer Price Index (mom)
% Change
Jun
(0.70)
China
Exports YoY%
% Change
Jun
8.70
9.00
Jul 14, 2017
India
Imports YoY%
% Change
Jun
33.10
India
Exports YoY%
% Change
Jun
8.30
6:45 PMUS
Industrial Production
%
Jun
-
0.30
6:00 PMUS
Consumer price index (mom)
% Change
Jun
(0.10)
0.10
12:00 PMIndia
Monthly Wholesale Prices YoY%
% Change
Jun
2.17
Jul 17, 2017
7:30 AMChina
Industrial Production (YoY)
% Change
Jun
6.50
6.50
7:30 AMChina
Real GDP (YoY)
% Change
2Q
6.90
6.80
Jul 18, 2017
2:00 PMUK
CPI (YoY)
% Change
Jun
2.90
2:30 PMEuro Zone
Euro-Zone CPI (YoY)
%
Jun F
1.30
Jul 19, 2017
6:00 PMUS
Housing Starts
Thousands
Jun
1,092.00
1,190.00
6:00 PMUS
Building permits
Thousands
Jun
1,168.00
1,205.00
Source: Bloomberg, Angel Research
Market Outlook
July 5, 2017
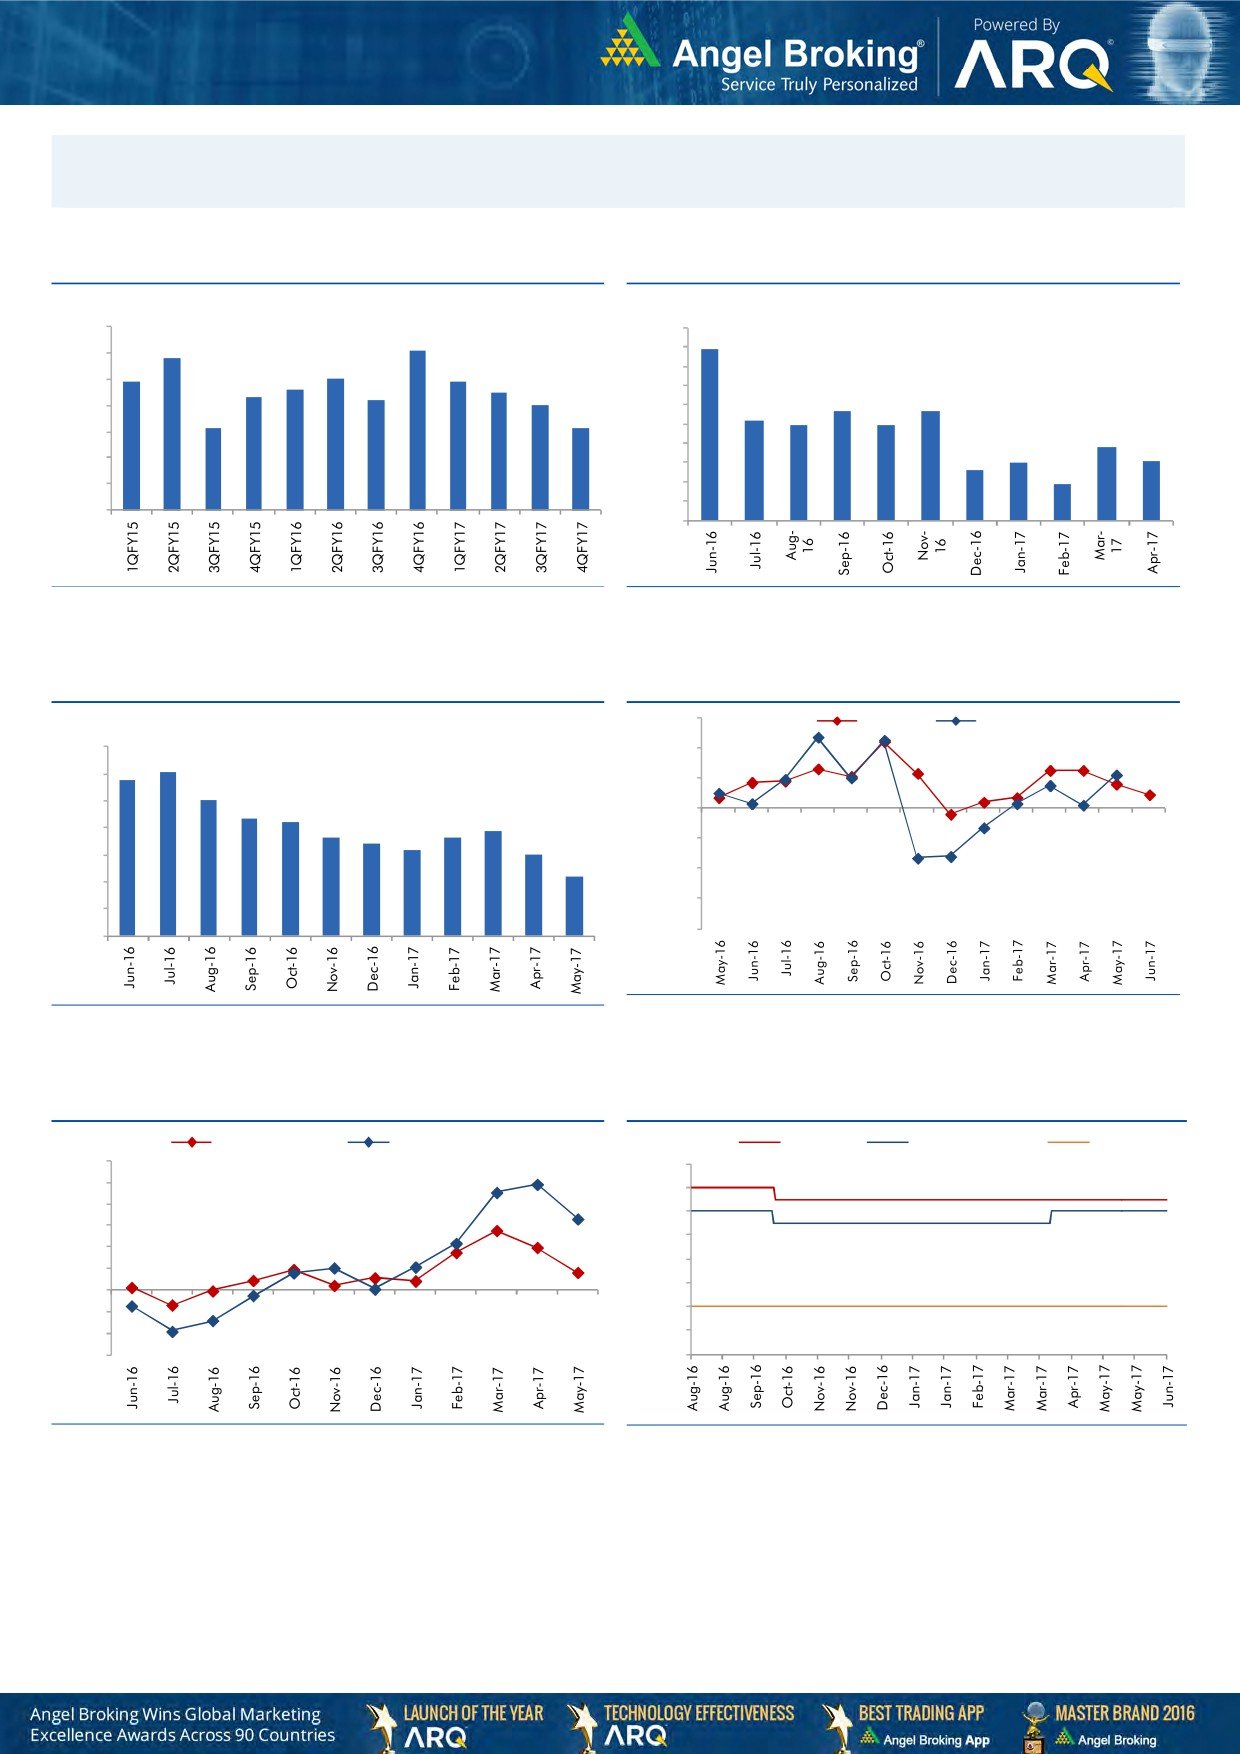
Macro watch
Exhibit 1: Quarterly GDP trends
Exhibit 2: IIP trends
(%)
(%)
10.0
10.0
9.1
8.9
8.8
9.0
9.0
7.9
8.0
7.9
8.0
7.6
7.5
8.0
7.3
7.2
7.0
7.0
5.7
5.7
7.0
6.0
5.2
6.1
6.1
4.9
4.9
6.0
5.0
3.8
4.0
3.0
3.1
2.6
5.0
3.0
1.9
4.0
2.0
1.0
3.0
-
Source: CSO, Angel Research
Source: MOSPI, Angel Research
Exhibit 3: Monthly CPI inflation trends
Exhibit 4: Manufacturing and services PMI
56.0
Mfg. PMI
Services PMI
(%)
7.0
54.0
6.1
5.8
6.0
52.0
5.1
5.0
4.3
4.2
50.0
3.9
3.6
3.7
4.0
3.4
3.2
3.0
48.0
3.0
2.2
46.0
2.0
44.0
1.0
42.0
-
Source: Market, Angel Research; Note: Level above 50 indicates expansion
Source: MOSPI, Angel Research
Exhibit 5: Exports and imports growth trends
Exhibit 6: Key policy rates
(%)
Exports yoy growth
Imports yoy growth
(%)
Repo rate
Reverse Repo rate
CRR
60.0
7.00
50.0
6.50
40.0
6.00
30.0
5.50
20.0
5.00
10.0
4.50
0.0
4.00
(10.0)
(20.0)
3.50
(30.0)
3.00
Source: Bloomberg, Angel Research
Source: RBI, Angel Research
Market Outlook
July 5, 2017
Global watch
Exhibit 1: Latest quarterly GDP Growth (%, yoy) across select developing and developed countries
(%)
8.0
6.9
7.0
5.6
6.0
5.3
5.0
1.0
5.0
4.0
3.3
2.9
3.0
2.0
2.0
0.5
2.0
1.1
1.3
1.0
-
(1.0)
(0.4)
Source: Bloomberg, Angel Research
Exhibit 2: 2016 GDP Growth projection by IMF (%, yoy) across select developing and developed countries
(%)
7.2
6.6
7.0
6.0
5.1
5.0
4.5
4.0
3.0
3.0
2.3
2.0
1.4
1.6
2.0
1.4
1.2
0.2
0.8
1.0
-
Source: IMF, Angel Research
Exhibit 3: One year forward P-E ratio across select developing and developed countries
(x)
20.0
18.0
16.0
14.0
12.0
10.0
8.0
6.0
4.0
2.0
-
Source: IMF, Angel Research
Market Outlook
July 5, 2017
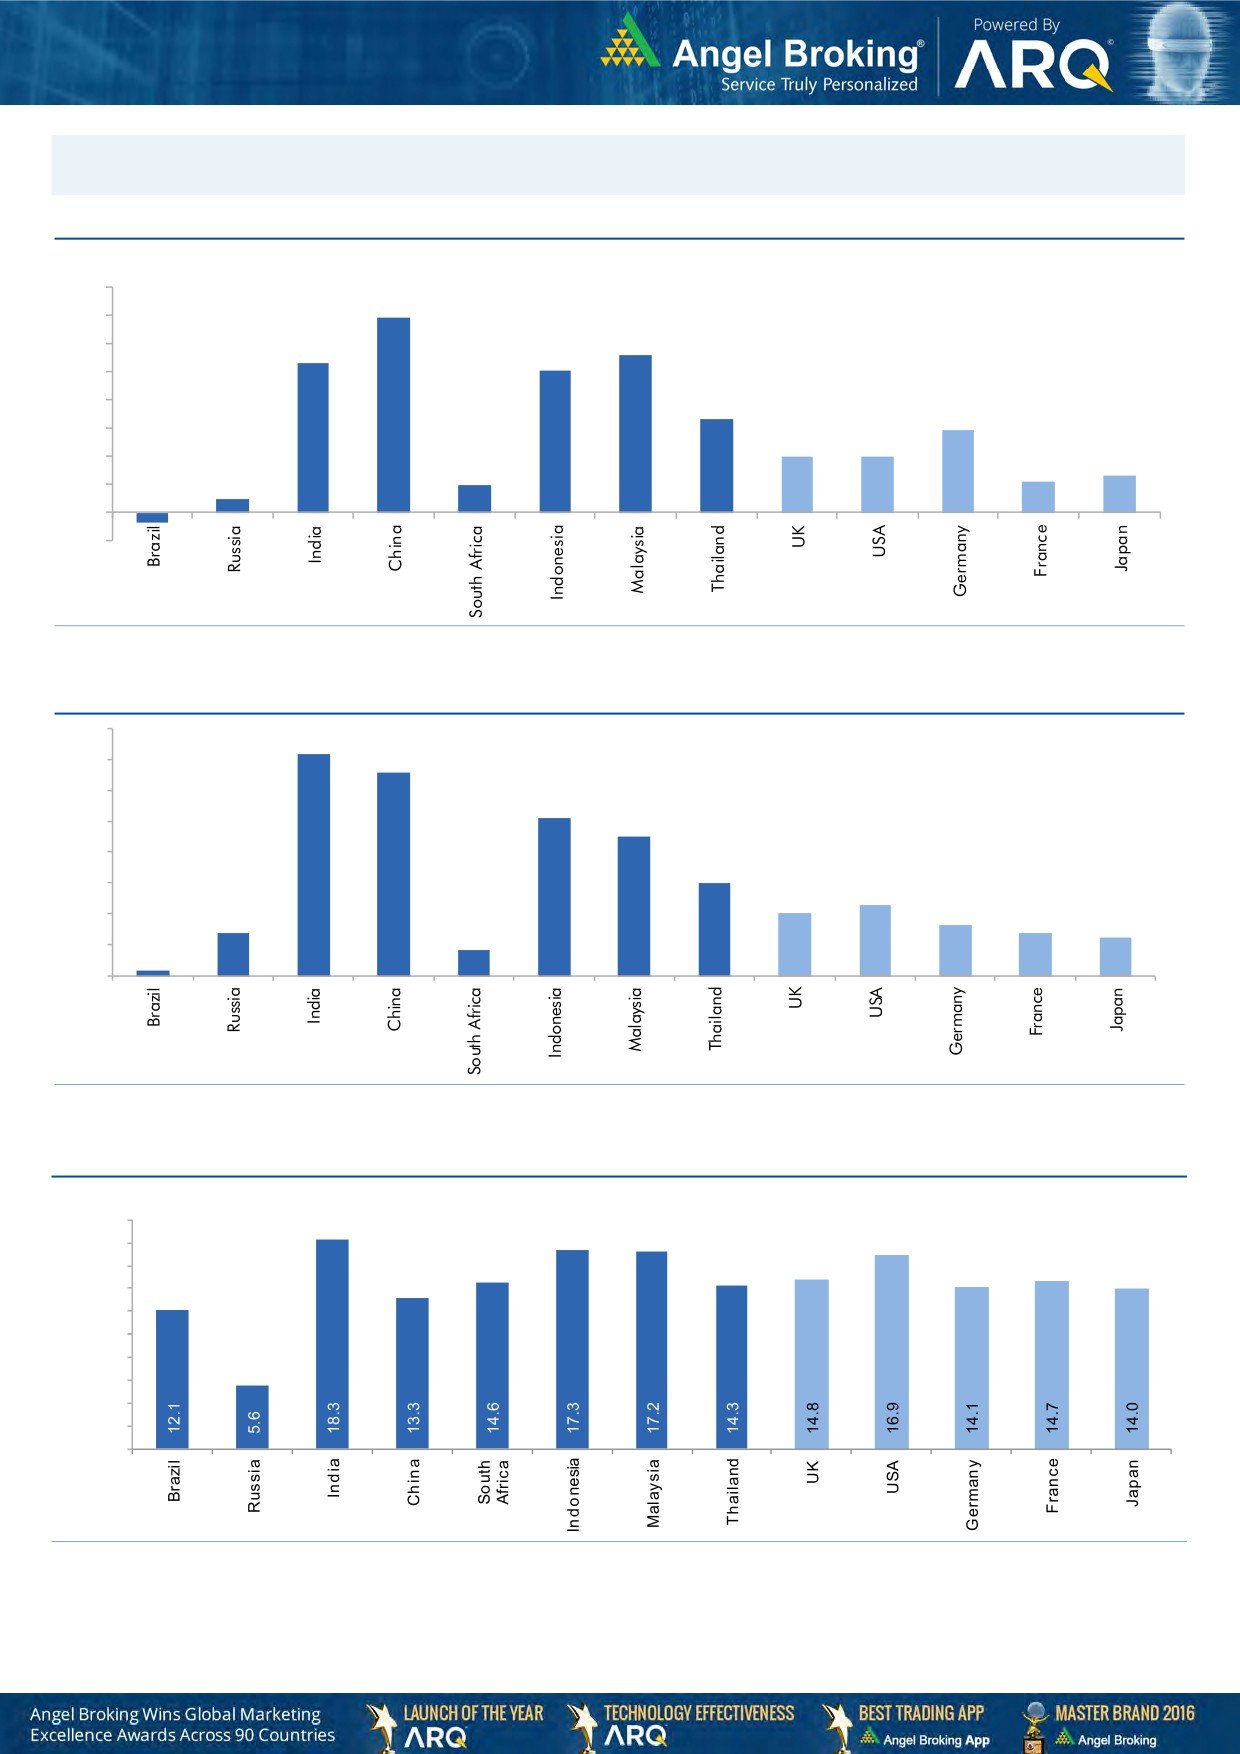
Exhibit 4: Relative performance of indices across globe
Returns (%)
Country
Name of index
Closing price
1M
3M
1YR
Brazil
Bovespa
63,232
1.5
(3.1)
22.7
Russia
Micex
1,917
2.6
(5.2)
2.0
India
Nifty
9,613
(0.0)
4.8
18.3
China
Shanghai Composite
3,183
2.9
(0.9)
10.0
South Africa
Top 40
45,820
(1.4)
0.9
(0.3)
Mexico
Mexbol
50,042
1.5
3.1
9.2
Indonesia
LQ45
987
3.6
7.0
20.0
Malaysia
KLCI
1,762
(0.2)
0.7
7.4
Thailand
SET 50
995
0.5
(0.2)
10.9
USA
Dow Jones
21,479
1.6
3.9
20.4
UK
FTSE
7,357
(2.5)
(0.2)
13.8
Japan
Nikkei
20,032
(0.7)
5.9
30.9
Germany
DAX
12,437
(1.8)
1.5
29.2
France
CAC
5,175
(3.2)
1.0
19.5
Source: Bloomberg, Angel Research,
Stock Watch
July 05, 2017
Company Name
Reco
CMP
Target
Mkt Cap
Sales ( Čcr )
OPM(%)
EPS (Č)
PER(x)
P/BV(x)
RoE(%)
EV/Sales(x)
(Č)
Price ( Č)
( Č cr )
FY17E FY18E
FY17E
FY18E
FY17E
FY18E
FY17E
FY18E
FY17E
FY18E
FY17E
FY18E
FY17E
FY18E
Agri / Agri Chemical
Rallis
Reduce
242
209
4,700
1,937
2,164
13.3
14.3
9.0
11.0
26.9
22.0
4.7
4.1
18.4
19.8
2.5
2.2
United Phosphorus
Neutral
845
-
42,941
15,176
17,604
18.5
18.5
37.4
44.6
22.6
19.0
4.4
3.7
21.4
21.2
2.9
2.5
Auto & Auto Ancillary
Ashok Leyland
Accumulate
99
111
29,060
20,021
21,915
11.6
11.9
4.5
5.3
22.1
18.7
4.5
4.0
20.6
21.5
1.4
1.3
Bajaj Auto
Neutral
2,771
-
80,191
25,093
27,891
19.5
19.2
143.9
162.5
19.3
17.1
5.4
4.6
30.3
29.4
2.9
2.6
Bharat Forge
Neutral
1,099
-
25,579
7,726
8,713
20.5
21.2
35.3
42.7
31.1
25.7
5.8
5.2
18.9
20.1
3.4
2.9
Eicher Motors
Neutral
27,851
-
75,816
16,583
20,447
17.5
18.0
598.0
745.2
46.6
37.4
15.9
12.1
41.2
38.3
4.4
3.5
Gabriel India
Neutral
151
-
2,163
1,544
1,715
9.0
9.3
5.4
6.3
27.9
23.9
5.3
4.7
18.9
19.5
1.4
1.2
Hero Motocorp
Neutral
3,700
-
73,887
28,083
30,096
15.3
15.7
171.8
187.0
21.5
19.8
7.5
6.3
30.1
27.9
2.5
2.2
Jamna Auto Industries Neutral
254
-
2,024
1,486
1,620
9.8
9.9
15.0
17.2
16.9
14.8
3.7
3.1
21.8
21.3
1.4
1.3
L G Balakrishnan & Bros Neutral
782
-
1,228
1,302
1,432
11.6
11.9
43.7
53.0
17.9
14.8
2.5
2.3
13.8
14.2
1.0
0.9
Mahindra and Mahindra Neutral
1,355
-
84,139
46,534
53,077
11.6
11.7
67.3
78.1
20.1
17.4
3.3
2.9
15.4
15.8
1.8
1.5
Maruti
Neutral
7,372
-
222,680
67,822
83,288
16.0
16.4
253.8
312.4
29.0
23.6
6.7
5.4
23.0
22.9
3.0
2.3
Minda Industries
Neutral
657
-
5,676
2,728
3,042
9.0
9.1
68.2
86.2
9.6
7.6
2.2
1.7
23.8
24.3
2.1
1.9
Motherson Sumi
Neutral
458
-
64,248
45,896
53,687
7.8
8.3
13.0
16.1
35.1
28.4
11.3
9.0
34.7
35.4
1.5
1.2
Rane Brake Lining
Neutral
1,327
-
1,050
511
562
11.3
11.5
28.1
30.9
47.2
42.9
7.2
6.6
15.3
15.0
2.2
2.0
Setco Automotive
Neutral
38
-
510
741
837
13.0
13.0
15.2
17.0
2.5
2.2
0.4
0.4
15.8
16.3
1.1
1.0
Tata Motors
Neutral
428
-
123,477
300,209
338,549
8.9
8.4
42.7
54.3
10.0
7.9
1.6
1.4
15.6
17.2
0.5
0.5
TVS Motor
Neutral
551
-
26,156
13,390
15,948
6.9
7.1
12.8
16.5
43.1
33.3
10.7
8.5
26.3
27.2
2.0
1.7
Amara Raja Batteries
Buy
855
1,009
14,607
5,305
6,100
16.0
16.3
28.4
34.0
30.1
25.2
5.8
4.9
19.3
19.3
2.8
2.4
Exide Industries
Neutral
226
-
19,231
7,439
8,307
15.0
15.0
8.1
9.3
27.9
24.3
3.9
3.5
14.3
16.7
2.2
2.0
Apollo Tyres
Neutral
252
-
12,805
12,877
14,504
14.3
13.9
21.4
23.0
11.7
10.9
1.8
1.6
16.4
15.2
1.2
1.1
Ceat
Neutral
1,857
-
7,511
7,524
8,624
13.0
12.7
131.1
144.3
14.2
12.9
2.6
2.2
19.8
18.6
1.1
0.9
JK Tyres
Neutral
167
-
3,782
7,455
8,056
15.0
15.0
21.8
24.5
7.7
6.8
1.6
1.3
22.8
21.3
0.6
0.5
Swaraj Engines
Neutral
2,340
-
2,906
660
810
15.2
16.4
54.5
72.8
42.9
32.1
13.4
12.1
31.5
39.2
4.2
3.4
Subros
Neutral
253
-
1,515
1,488
1,681
11.7
11.9
6.4
7.2
39.5
35.2
4.2
3.8
10.8
11.4
1.3
1.1
Indag Rubber
Neutral
208
-
547
286
326
19.8
16.8
11.7
13.3
17.8
15.6
3.0
2.8
17.8
17.1
1.6
1.4
Capital Goods
ACE
Neutral
73
-
720
709
814
4.1
4.6
1.4
2.1
52.0
34.7
2.1
2.0
4.4
6.0
1.2
1.0
BEML
Neutral
1,518
-
6,323
3,451
4,055
6.3
9.2
31.4
57.9
48.4
26.2
2.9
2.6
6.3
10.9
2.0
1.6
Bharat Electronics
Neutral
163
-
36,497
8,137
9,169
16.8
17.2
58.7
62.5
2.8
2.6
0.4
0.4
44.6
46.3
3.5
3.1
Stock Watch
July 05, 2017
Company Name
Reco
CMP
Target
Mkt Cap
Sales ( Čcr )
OPM(%)
EPS (Č)
PER(x)
P/BV(x)
RoE(%)
EV/Sales(x)
(Č)
Price ( Č)
( Č cr )
FY17E
FY18E
FY17E
FY18E
FY17E
FY18E
FY17E
FY18E
FY17E
FY18E
FY17E
FY18E
FY17E
FY18E
Capital Goods
Voltas
Neutral
462
-
15,297
6,511
7,514
7.9
8.7
12.9
16.3
35.8
28.4
6.5
5.7
16.7
18.5
2.1
1.8
BGR Energy
Neutral
154
-
1,108
16,567
33,848
6.0
5.6
7.8
5.9
19.7
26.0
1.1
1.1
4.7
4.2
0.2
0.1
BHEL
Neutral
134
-
32,773
28,797
34,742
-
2.8
2.3
6.9
58.2
19.4
1.0
1.0
1.3
4.8
0.8
0.5
Blue Star
Buy
617
760
5,899
4,283
5,077
5.9
7.3
14.9
22.1
41.4
27.9
8.0
6.8
20.4
26.4
1.4
1.2
CG Power and Industrial
Neutral
82
-
5,168
5,777
6,120
5.9
7.0
3.3
4.5
25.0
18.3
1.1
1.1
4.4
5.9
0.9
0.7
Solutions
Greaves Cotton
Neutral
160
-
3,917
1,755
1,881
16.8
16.9
7.8
8.5
20.6
18.9
4.1
3.8
20.6
20.9
1.9
1.8
Inox Wind
Neutral
144
-
3,198
5,605
6,267
15.7
16.4
24.8
30.0
5.8
4.8
1.6
1.2
25.9
24.4
0.6
0.5
KEC International
Neutral
262
-
6,727
9,294
10,186
7.9
8.1
9.9
11.9
26.4
22.0
3.9
3.4
15.6
16.3
1.0
0.9
KEI Industries
Accumulate
232
258
1,808
2,633
3,001
10.4
10.0
12.7
13.0
18.3
17.9
3.9
3.3
21.4
18.2
0.9
0.8
Thermax
Neutral
937
-
11,164
5,421
5,940
7.3
7.3
25.7
30.2
36.5
31.0
4.4
4.0
12.2
13.1
1.9
1.8
VATech Wabag
Neutral
680
-
3,713
3,136
3,845
8.9
9.1
26.0
35.9
26.2
19.0
3.3
2.8
13.4
15.9
1.1
0.9
Cement
ACC
Neutral
1,581
-
29,697
11,225
13,172
13.2
16.9
44.5
75.5
35.5
21.0
3.4
3.1
11.2
14.2
2.7
2.3
Ambuja Cements
Neutral
249
-
49,423
9,350
10,979
18.2
22.5
5.8
9.5
42.9
26.2
3.6
3.2
10.2
12.5
5.3
4.5
India Cements
Neutral
203
-
6,254
4,364
4,997
18.5
19.2
7.9
11.3
25.7
18.0
1.9
1.8
8.0
8.5
2.2
1.9
JK Cement
Neutral
970
-
6,784
4,398
5,173
15.5
17.5
31.2
55.5
31.1
17.5
3.7
3.2
12.0
15.5
2.1
1.7
J K Lakshmi Cement
Neutral
479
-
5,633
2,913
3,412
14.5
19.5
7.5
22.5
63.8
21.3
3.9
3.3
12.5
18.0
2.5
2.1
Orient Cement
Neutral
150
-
3,067
2,114
2,558
18.5
20.5
8.1
11.3
18.5
13.3
2.7
2.3
9.0
14.0
2.1
1.6
UltraTech Cement
Neutral
4,018
-
110,295
25,768
30,385
21.0
23.5
111.0
160.0
36.2
25.1
4.6
4.0
13.5
15.8
4.4
3.6
Construction
ITNL
Neutral
97
-
3,206
8,946
10,017
31.0
31.6
8.1
9.1
12.0
10.7
0.4
0.5
4.2
5.0
3.7
3.4
KNR Constructions
Neutral
208
-
2,919
1,385
1,673
14.7
14.0
41.2
48.5
5.0
4.3
0.9
0.8
14.9
15.2
2.2
1.8
Larsen & Toubro
Neutral
1,684
-
157,173
111,017
124,908
11.0
11.0
61.1
66.7
27.6
25.2
3.3
3.1
13.1
12.9
2.5
2.3
Gujarat Pipavav Port
Neutral
148
-
7,165
705
788
52.2
51.7
5.0
5.6
29.6
26.5
2.9
2.6
11.2
11.2
9.8
8.3
Nagarjuna Const.
Neutral
89
-
4,948
8,842
9,775
9.1
8.8
5.3
6.4
16.8
13.9
1.3
1.2
8.2
9.1
0.7
0.6
PNC Infratech
Neutral
143
-
3,670
2,350
2,904
13.1
13.2
9.0
8.8
15.9
16.3
0.6
0.5
15.9
13.9
1.7
1.4
Simplex Infra
Neutral
533
-
2,636
6,829
7,954
10.5
10.5
31.4
37.4
17.0
14.3
1.8
1.6
9.9
13.4
0.8
0.7
Power Mech Projects
Neutral
598
-
880
1,801
2,219
12.7
14.6
72.1
113.9
8.3
5.3
1.5
1.3
16.8
11.9
0.5
0.4
Sadbhav Engineering
Neutral
308
-
5,285
3,598
4,140
10.3
10.6
9.0
11.9
34.2
25.9
3.6
3.1
9.9
11.9
1.8
1.5
NBCC
Neutral
205
-
18,459
7,428
9,549
7.9
8.6
8.2
11.0
25.0
18.7
1.2
1.0
28.2
28.7
2.2
1.7
MEP Infra
Neutral
120
-
1,950
1,877
1,943
30.6
29.8
3.0
4.2
40.0
28.6
19.4
13.0
0.6
0.6
2.4
2.2
Stock Watch
July 05, 2017
Company Name
Reco
CMP
Target
Mkt Cap
Sales ( Čcr )
OPM(%)
EPS (Č)
PER(x)
P/BV(x)
RoE(%)
EV/Sales(x)
(Č)
Price ( Č)
( Č cr )
FY17E
FY18E
FY17E
FY18E
FY17E
FY18E
FY17E
FY18E
FY17E
FY18E
FY17E
FY18E
FY17E
FY18E
Construction
SIPL
Neutral
108
-
3,795
1,036
1,252
65.5
66.2
(8.4)
(5.6)
4.0
4.6
(22.8)
(15.9)
11.9
9.9
Engineers India
Neutral
155
-
10,448
1,725
1,935
16.0
19.1
11.4
13.9
13.6
11.2
1.9
1.8
13.4
15.3
5.0
4.5
Financials
Axis Bank
Accumulate
509
580
122,004
46,932
53,575
3.5
3.4
32.4
44.6
15.7
11.4
2.0
1.8
13.6
16.5
-
-
Bank of Baroda
Neutral
159
-
36,740
19,980
23,178
1.8
1.8
11.5
17.3
13.9
9.2
1.6
1.3
8.3
10.1
-
-
Canara Bank
Neutral
332
-
19,824
15,225
16,836
1.8
1.8
14.5
28.0
22.9
11.9
1.6
1.3
5.8
8.5
-
-
Can Fin Homes
Neutral
3,201
-
8,522
420
526
3.5
3.5
86.5
107.8
37.0
29.7
8.0
6.5
23.6
24.1
-
-
Cholamandalam Inv. &
Accumulate
1,092
1,230
17,070
2,012
2,317
6.3
6.3
42.7
53.6
25.6
20.4
4.1
3.5
16.9
18.3
-
-
Fin. Co.
Dewan Housing Finance Buy
436
520
13,669
2,225
2,688
2.9
2.9
29.7
34.6
14.7
12.6
2.4
1.6
16.1
14.8
-
-
Equitas Holdings
Buy
150
235
5,087
939
1,281
11.7
11.5
5.8
8.2
25.9
18.3
2.2
2.0
10.9
11.5
-
-
Federal Bank
Accumulate
112
125
21,771
8,259
8,995
3.0
3.0
4.3
5.6
26.1
20.0
2.2
2.0
8.5
10.1
-
-
HDFC
Neutral
1,640
-
261,298
11,475
13,450
3.4
3.4
45.3
52.5
36.2
31.3
7.0
6.2
20.2
20.5
-
-
HDFC Bank
Neutral
1,652
-
425,128
46,097
55,433
4.5
4.5
58.4
68.0
28.3
24.3
5.0
4.1
18.8
18.6
-
-
ICICI Bank
Accumulate
289
315
185,619
42,800
44,686
3.1
3.3
18.0
21.9
16.1
13.2
2.2
2.0
11.1
12.3
-
-
Karur Vysya Bank
Accumulate
145
160
8,735
5,640
6,030
3.3
3.2
8.9
10.0
16.2
14.5
1.7
1.6
11.2
11.4
-
-
Lakshmi Vilas Bank
Neutral
207
-
3,964
3,339
3,799
2.7
2.8
11.0
14.0
18.8
14.8
2.0
1.8
11.2
12.7
-
-
LIC Housing Finance
Neutral
747
-
37,703
3,712
4,293
2.6
2.5
39.0
46.0
19.2
16.2
3.6
3.1
19.9
20.1
-
-
Punjab Natl.Bank
Neutral
137
-
29,079
23,532
23,595
2.3
2.4
6.8
12.6
20.1
10.9
3.1
2.2
3.3
6.5
-
-
RBL Bank
Neutral
522
-
19,663
1,783
2,309
2.6
2.6
12.7
16.4
41.1
31.8
4.5
4.0
12.8
13.3
-
-
Repco Home Finance
Neutral
802
-
5,018
388
457
4.5
4.2
30.0
38.0
26.7
21.1
4.5
3.7
18.0
19.2
-
-
South Ind.Bank
Neutral
28
-
4,986
6,435
7,578
2.5
2.5
2.7
3.1
10.2
8.9
1.3
1.1
10.1
11.2
-
-
St Bk of India
Neutral
273
-
235,655
88,650
98,335
2.6
2.6
13.5
18.8
20.2
14.5
1.9
1.7
7.0
8.5
-
-
Union Bank
Neutral
146
-
10,050
13,450
14,925
2.3
2.3
25.5
34.5
5.7
4.2
0.8
0.7
7.5
10.2
-
-
Yes Bank
Neutral
1,485
-
67,946
8,978
11,281
3.3
3.4
74.0
90.0
20.1
16.5
3.8
3.2
17.0
17.2
-
-
FMCG
Akzo Nobel India
Neutral
1,850
-
8,873
2,955
3,309
13.3
13.7
57.2
69.3
32.4
26.7
10.6
8.9
32.7
33.3
2.8
2.5
Asian Paints
Neutral
1,109
-
106,351
17,128
18,978
16.8
16.4
19.1
20.7
58.1
53.6
20.2
19.1
34.8
35.5
6.1
5.5
Britannia
Neutral
3,751
-
45,020
9,594
11,011
14.6
14.9
80.3
94.0
46.7
39.9
19.2
14.8
41.2
-
4.6
3.9
Colgate
Neutral
1,126
-
30,631
4,605
5,149
23.4
23.4
23.8
26.9
47.3
41.9
26.2
20.5
64.8
66.8
6.6
5.9
Dabur India
Neutral
295
-
51,991
8,315
9,405
19.8
20.7
8.1
9.2
36.4
32.1
10.1
8.4
31.6
31.0
5.9
5.2
GlaxoSmith Con*
Neutral
5,400
-
22,712
4,350
4,823
21.2
21.4
179.2
196.5
30.1
27.5
8.0
6.8
27.1
26.8
4.6
4.1
Stock Watch
July 05, 2017
Company Name
Reco
CMP
Target
Mkt Cap
Sales ( Čcr )
OPM(%)
EPS (Č)
PER(x)
P/BV(x)
RoE(%)
EV/Sales(x)
(Č)
Price ( Č)
( Č cr )
FY17E FY18E
FY17E
FY18E
FY17E
FY18E
FY17E
FY18E
FY17E
FY18E
FY17E
FY18E
FY17E
FY18E
FMCG
Godrej Consumer
Neutral
986
-
67,160
10,235
11,428
18.4
18.6
41.1
44.2
24.0
22.3
5.3
4.5
24.9
24.8
6.6
5.9
HUL
Neutral
1,090
-
235,992
35,252
38,495
17.8
17.8
20.7
22.4
52.8
48.7
50.5
43.3
95.6
88.9
6.5
6.0
ITC
Neutral
337
-
409,488
40,059
44,439
38.3
39.2
9.0
10.1
37.6
33.3
10.5
9.1
27.8
27.5
9.7
8.8
Marico
Neutral
323
-
41,631
6,430
7,349
18.8
19.5
6.4
7.7
50.4
41.9
15.2
12.8
33.2
32.5
6.3
5.4
Nestle*
Neutral
6,849
-
66,034
10,073
11,807
20.7
21.5
124.8
154.2
54.9
44.4
22.5
20.3
34.8
36.7
6.4
5.4
Tata Global
Neutral
150
-
9,470
8,675
9,088
9.8
9.8
7.4
8.2
20.3
18.3
1.6
1.5
7.9
8.1
1.0
0.9
Procter & Gamble
Neutral
8,000
-
25,969
2,939
3,342
23.2
23.0
146.2
163.7
54.7
48.9
13.9
11.5
25.3
23.5
8.4
7.3
Hygiene
IT
HCL Tech^
Buy
840
1,014
119,917
46,723
52,342
22.1
20.9
60.0
62.8
14.0
13.4
3.6
3.0
25.3
22.4
2.3
2.0
Infosys
Buy
961
1,179
220,622
68,484
73,963
26.0
26.0
63.0
64.0
15.3
15.0
3.2
2.9
20.8
19.7
2.9
2.5
TCS
Accumulate
2,364
2,651
465,809
117,966
127,403
27.5
27.6
134.3
144.5
17.6
16.4
5.2
4.9
29.8
29.7
3.6
3.4
Tech Mahindra
Buy
378
533
36,838
29,141
31,051
14.4
15.0
32.3
35.6
11.7
10.6
2.0
1.8
17.1
17.0
1.1
1.0
Wipro
Accumulate
260
280
126,471
55,421
58,536
20.3
20.3
35.1
36.5
7.4
7.1
1.3
1.1
19.2
14.6
1.7
1.5
Media
D B Corp
Neutral
381
-
7,008
2,297
2,590
27.4
28.2
21.0
23.4
18.1
16.3
4.2
3.7
23.7
23.1
2.9
2.5
HT Media
Neutral
81
-
1,881
2,693
2,991
12.6
12.9
7.9
9.0
10.2
9.0
0.9
0.8
7.8
8.3
0.3
0.2
Jagran Prakashan
Buy
186
225
6,069
2,283
2,555
28.0
28.0
10.6
12.3
17.5
15.2
3.7
3.2
21.4
21.4
2.7
2.3
Sun TV Network
Neutral
815
-
32,114
2,850
3,265
70.1
71.0
26.2
30.4
31.1
26.8
8.0
7.0
24.3
25.6
10.9
9.3
Hindustan Media
Neutral
274
-
2,009
1,016
1,138
24.3
25.2
27.3
30.1
10.0
9.1
1.9
1.7
16.2
15.8
1.3
1.1
Ventures
TV Today Network
Buy
235
344
1,399
608
667
21.5
22.3
15.7
19.2
15.0
12.2
2.3
2.0
16.1
16.0
1.9
1.6
Metals & Mining
Coal India
Neutral
247
-
153,230
84,638
94,297
21.4
22.3
24.5
27.1
10.1
9.1
4.2
4.0
42.6
46.0
1.3
1.2
Hind. Zinc
Neutral
265
-
112,055
14,252
18,465
55.9
48.3
15.8
21.5
16.8
12.3
2.7
2.4
17.0
20.7
7.9
6.1
Hindalco
Neutral
198
-
44,386
107,899
112,095
7.4
8.2
9.2
13.0
21.5
15.2
1.0
1.0
4.8
6.6
0.9
0.9
JSW Steel
Neutral
208
-
50,266
53,201
58,779
16.1
16.2
130.6
153.7
1.6
1.4
0.2
0.2
14.0
14.4
1.7
1.5
NMDC
Neutral
111
-
35,262
6,643
7,284
44.4
47.7
7.1
7.7
15.7
14.5
1.4
1.3
8.8
9.2
3.1
2.8
SAIL
Neutral
58
-
24,140
47,528
53,738
(0.7)
2.1
(1.9)
2.6
22.5
0.6
0.6
(1.6)
3.9
1.4
1.2
Vedanta
Neutral
255
-
94,881
71,744
81,944
19.2
21.7
13.4
20.1
19.1
12.7
1.6
1.5
8.4
11.3
1.7
1.4
Tata Steel
Neutral
546
-
53,062
121,374
121,856
7.2
8.4
18.6
34.3
29.4
15.9
1.8
1.7
6.1
10.1
1.1
1.1
Oil & Gas
GAIL
Neutral
364
-
61,614
56,220
65,198
9.3
10.1
27.1
33.3
13.4
10.9
1.2
1.1
9.3
10.7
1.3
1.1
ONGC
Neutral
160
-
205,268
137,222
152,563
15.0
21.8
19.5
24.1
8.2
6.6
0.7
0.7
8.5
10.1
1.8
1.6
Indian Oil Corp
Neutral
382
-
185,423
373,359
428,656
5.9
5.5
54.0
59.3
7.1
6.4
1.1
1.0
16.0
15.6
0.7
0.6
Stock Watch
July 05, 2017
Company Name
Reco
CMP
Target
Mkt Cap
Sales ( Čcr )
OPM(%)
EPS (Č)
PER(x)
P/BV(x)
RoE(%)
EV/Sales(x)
(Č)
Price ( Č)
( Č cr )
FY17E FY18E
FY17E
FY18E
FY17E
FY18E
FY17E
FY18E
FY17E
FY18E
FY17E
FY18E
FY17E
FY18E
Oil & Gas
Reliance Industries
Neutral
1,423
-
462,600
301,963
358,039
12.1
12.6
87.7
101.7
16.2
14.0
1.7
1.5
10.7
11.3
2.0
1.7
Pharmaceuticals
Alembic Pharma
Buy
512
648
9,644
3,101
3,966
19.7
20.5
21.4
25.5
23.9
20.1
5.1
4.1
23.0
22.8
3.1
2.3
Alkem Laboratories Ltd
Buy
1,836
2,161
21,953
5,853
6,901
17.1
18.4
74.6
85.0
24.6
21.6
5.2
4.4
21.1
20.2
3.7
3.2
Aurobindo Pharma
Buy
679
823
39,776
14,845
17,086
21.5
22.1
39.4
44.7
17.2
15.2
4.2
3.4
27.6
24.7
2.8
2.4
Aventis*
Neutral
4,215
-
9,707
2,206
2,508
16.6
16.8
128.9
139.9
32.7
30.1
5.6
4.4
21.6
23.5
4.2
3.5
Cadila Healthcare
Reduce
515
450
52,692
9,220
11,584
18.4
20.3
14.5
18.7
35.5
27.5
7.6
6.1
23.5
24.6
6.0
4.6
Cipla
Sell
546
461
43,925
14,281
16,619
15.4
16.2
12.5
19.7
43.7
27.7
3.5
3.2
8.4
12.0
3.2
2.8
Dr Reddy's
Neutral
2,630
-
43,596
14,081
15,937
16.1
18.6
72.6
105.9
36.2
24.8
3.6
3.2
9.6
13.6
3.3
2.9
Dishman Pharma
Sell
143
1,718
1,890
22.7
22.8
9.5
11.3
10.1
10.9
3.3
2.9
GSK Pharma*
Neutral
2,527
-
21,401
2,927
3,290
11.8
16.2
34.4
49.6
73.5
50.9
10.7
11.1
13.9
21.3
7.1
6.4
Indoco Remedies
Sell
205
153
1,893
1,067
1,154
12.1
14.9
8.4
11.3
24.5
18.2
2.9
2.6
12.6
15.0
2.0
1.9
Ipca labs
Buy
484
620
6,105
3,211
3,593
13.9
14.5
15.4
19.4
31.4
24.9
2.5
2.3
8.2
9.5
2.0
1.8
Lupin
Buy
1,044
1,526
47,169
17,120
18,657
24.1
24.1
56.9
61.1
18.4
17.1
3.5
2.9
20.7
18.6
3.1
2.5
Natco Pharma
Accumulate
990
1,060
17,263
2,065
1,988
33.1
33.7
27.9
25.7
35.5
38.5
10.4
8.8
29.2
22.9
8.5
8.5
Sun Pharma
Buy
552
712
132,414
30,264
32,899
29.0
26.9
32.7
31.6
16.9
17.5
3.6
3.1
22.2
18.7
4.1
3.7
Power
Tata Power
Neutral
81
-
21,963
36,916
39,557
17.4
27.1
5.1
6.3
15.9
12.9
1.4
1.3
9.0
10.3
1.6
1.4
NTPC
Neutral
158
-
130,155
86,605
95,545
17.5
20.8
11.8
13.4
13.4
11.8
1.4
1.3
10.5
11.1
2.8
2.8
Power Grid
Accumulate
210
223
109,994
25,315
29,193
88.2
88.7
14.2
17.2
14.9
12.3
2.3
2.0
15.2
16.1
9.0
8.1
Real Estate
Prestige Estate
Neutral
248
-
9,294
4,707
5,105
25.2
26.0
10.3
13.0
24.1
19.1
1.9
1.8
10.3
10.2
3.1
2.8
MLIFE
Buy
447
522
2,292
1,152
1,300
22.7
24.6
29.9
35.8
14.9
12.5
1.1
1.0
7.6
8.6
2.7
2.3
Telecom
Bharti Airtel
Neutral
379
-
151,621
105,086
114,808
34.5
34.7
12.2
16.4
31.1
23.1
2.1
2.0
6.8
8.4
2.4
2.1
Idea Cellular
Neutral
84
-
30,291
40,133
43,731
37.2
37.1
6.4
6.5
13.1
12.9
1.1
1.0
8.2
7.6
1.8
1.5
zOthers
Abbott India
Neutral
4,233
-
8,994
3,153
3,583
14.1
14.4
152.2
182.7
27.8
23.2
136.5
116.6
25.6
26.1
2.6
2.2
Asian Granito
Accumulate
449
480
1,352
1,066
1,169
11.6
12.5
13.0
16.0
34.6
28.1
3.4
3.0
9.5
10.7
1.6
1.4
Bajaj Electricals
Buy
325
395
3,299
4,801
5,351
5.7
6.2
10.4
13.7
31.2
23.8
3.9
3.4
12.4
14.5
0.7
0.6
Banco Products (India)
Neutral
215
-
1,539
1,353
1,471
12.3
12.4
14.5
16.3
14.8
13.2
20.5
18.5
14.5
14.6
1.1
115.8
Coffee Day Enterprises
Neutral
249
-
5,120
2,964
3,260
20.5
21.2
4.7
8.0
-
31.1
2.9
2.6
5.5
8.5
2.1
1.9
Ltd
Competent Automobiles Neutral
188
-
121
1,137
1,256
3.1
2.7
28.0
23.6
6.7
8.0
36.2
32.7
14.3
11.5
0.1
0.1
Elecon Engineering
Neutral
60
-
670
1,482
1,660
13.7
14.5
3.9
5.8
15.3
10.3
3.6
3.3
7.8
10.9
0.8
0.7
Stock Watch
July 05, 2017
Company Name
Reco
CMP
Target
Mkt Cap
Sales ( Čcr )
OPM(%)
EPS (Č)
PER(x)
P/BV(x)
RoE(%)
EV/Sales(x)
(Č)
Price ( Č)
( Č cr )
FY17E
FY18E
FY17E
FY18E
FY17E
FY18E
FY17E
FY18E
FY17E
FY18E
FY17E
FY18E
FY17E
FY18E
zOthers
Finolex Cables
Neutral
480
-
7,340
2,883
3,115
12.0
12.1
14.2
18.6
33.8
25.8
18.0
15.7
15.8
14.6
2.2
2.0
Garware Wall Ropes
Neutral
835
-
1,827
863
928
15.1
15.2
36.4
39.4
22.9
21.2
4.2
3.5
17.5
15.9
2.0
1.9
Goodyear India*
Neutral
900
-
2,076
1,598
1,704
10.4
10.2
49.4
52.6
18.2
17.1
84.1
73.8
18.2
17.0
1.0
140.6
Hitachi
Neutral
1,991
-
5,415
2,081
2,433
8.8
8.9
33.4
39.9
59.6
49.9
48.1
40.1
22.1
21.4
2.6
2.2
HSIL
Neutral
376
-
2,719
2,384
2,515
15.8
16.3
15.3
19.4
24.6
19.4
24.4
21.0
7.8
9.3
1.3
1.2
Interglobe Aviation
Neutral
1,195
-
43,193
21,122
26,005
14.5
27.6
110.7
132.1
10.8
9.0
64.6
46.1
168.5
201.1
2.0
1.6
Jyothy Laboratories
Neutral
354
-
6,424
1,440
2,052
11.5
13.0
8.5
10.0
41.6
35.4
10.1
9.3
18.6
19.3
4.7
3.3
Kirloskar Engines India
Neutral
389
-
5,620
2,554
2,800
9.9
10.0
10.5
12.1
37.0
32.1
15.5
14.6
10.7
11.7
1.8
1.6
Ltd
Linc Pen & Plastics
Neutral
272
-
402
382
420
9.3
9.5
13.5
15.7
20.2
17.3
3.5
3.0
17.1
17.3
1.1
1.0
M M Forgings
Neutral
630
-
760
546
608
20.4
20.7
41.3
48.7
15.3
12.9
86.2
76.3
16.6
17.0
1.2
1.1
Manpasand Bever.
Neutral
777
-
4,448
836
1,087
19.6
19.4
16.9
23.8
46.0
32.6
5.5
4.8
12.0
14.8
5.1
3.8
Mirza International
Neutral
169
-
2,028
963
1,069
17.2
18.0
6.1
7.5
27.5
22.5
4.2
3.6
15.0
15.7
2.3
2.1
MT Educare
Neutral
63
-
252
366
417
17.7
18.2
9.4
10.8
6.8
5.9
1.5
1.3
22.2
22.3
0.6
0.5
Narayana Hrudaya
Neutral
315
-
6,446
1,873
2,166
11.5
11.7
2.6
4.0
119.3
79.6
7.3
6.6
6.1
8.3
3.5
3.0
Navkar Corporation
Buy
206
265
2,935
347
371
43.2
37.3
6.7
6.0
30.9
34.3
2.1
1.9
6.2
10.6
9.6
9.0
Navneet Education
Neutral
178
-
4,146
1,062
1,147
24.0
24.0
6.1
6.6
29.1
26.8
6.0
5.3
20.6
19.8
4.0
3.7
Nilkamal
Neutral
1,930
-
2,880
1,995
2,165
10.7
10.4
69.8
80.6
27.7
24.0
110.3
95.8
16.6
16.5
1.4
1.3
Page Industries
Neutral
17,447
-
19,460
2,450
3,124
20.1
17.6
299.0
310.0
58.4
56.3
388.6
296.6
47.1
87.5
8.0
6.3
Parag Milk Foods
Neutral
217
-
1,825
1,919
2,231
9.3
9.6
9.5
12.9
23.0
16.8
3.6
2.9
15.5
17.5
1.1
0.9
Quick Heal
Neutral
205
-
1,441
408
495
27.3
27.0
7.7
8.8
26.5
23.4
2.5
2.5
9.3
10.6
2.7
2.2
Radico Khaitan
Buy
128
147
1,698
1,667
1,824
13.0
13.2
6.7
8.2
19.2
15.6
1.7
1.6
9.0
10.2
1.4
1.3
Relaxo Footwears
Neutral
543
-
6,526
2,085
2,469
9.2
8.2
7.6
8.0
71.9
68.4
27.9
23.8
17.9
18.8
3.2
2.7
S H Kelkar & Co.
Neutral
260
-
3,764
1,036
1,160
15.1
15.0
6.1
7.2
42.6
36.3
4.6
4.2
10.7
11.5
3.5
3.1
Siyaram Silk Mills
Buy
2,136
2,500
2,002
1,574
1,769
12.5
12.7
97.1
113.1
22.0
18.9
3.4
2.9
15.4
15.5
1.5
1.3
Styrolution ABS India*
Neutral
888
-
1,562
1,440
1,537
9.2
9.0
40.6
42.6
21.9
20.8
55.9
50.8
12.3
11.6
1.0
0.9
Surya Roshni
Neutral
286
-
1,253
3,342
3,625
7.8
7.5
17.3
19.8
16.5
14.5
31.4
25.2
10.5
10.8
0.6
0.6
Team Lease Serv.
Neutral
1,414
-
2,417
3,229
4,001
1.5
1.8
22.8
32.8
62.1
43.1
6.7
5.8
10.7
13.4
0.7
0.5
The Byke Hospitality
Neutral
188
-
755
287
384
20.5
20.5
7.6
10.7
24.8
17.6
5.2
4.2
20.7
23.5
2.6
2.0
Transport Corporation of
Neutral
334
-
2,558
2,671
2,911
8.5
8.8
13.9
15.7
24.1
21.3
3.3
2.9
13.7
13.8
1.1
1.0
India
Stock Watch
July 05, 2017
Company Name
Reco
CMP
Target Mkt Cap
Sales ( Čcr )
OPM(%)
EPS (Č)
PER(x)
P/BV(x)
RoE(%)
EV/Sales(x)
(Č)
Price ( Č)
( Č cr )
FY17E FY18E FY17E FY18E FY17E FY18E FY17E FY18E FY17E FY18E FY17E FY18E FY17E FY18E
zOthers
TVS Srichakra
Neutral
3,802
-
2,911
2,304
2,614
13.7
13.8
231.1
266.6
16.5
14.3
427.2
336.4
33.9
29.3
1.3
1.1
UFO Moviez
Neutral
385
-
1,064
619
685
33.2
33.4
30.0
34.9
12.9
11.0
1.8
1.5
13.8
13.9
1.4
1.1
Visaka Industries
Neutral
509
-
808
1,051
1,138
10.3
10.4
21.0
23.1
24.2
22.0
65.3
61.1
9.0
9.2
1.0
1.0
VRL Logistics
Neutral
336
-
3,069
1,902
2,119
16.7
16.6
14.6
16.8
23.1
20.0
5.1
4.4
21.9
22.2
1.7
1.5
VIP Industries
Accumulate
190
218
2,691
1,270
1,450
10.4
10.4
5.6
6.5
34.0
29.3
7.1
6.1
20.7
21.1
2.1
1.8
Navin Fluorine
Buy
3,025
3,650
2,977
789
945
21.1
22.4
120.1
143.4
25.2
21.1
4.1
3.5
17.8
18.5
3.7
3.0
Source: Company, Angel Research; Note: *December year end; #September year end; &October year end; Price as on July 04, 2017
Market Outlook
July 05, 2017
Research Team Tel: 022 - 39357800
DISCLAIMER
Angel Broking Private Limited (hereinafter referred to as “Angel”) is a registered Member of National Stock Exchange of India
Limited,Bombay Stock Exchange Limited and Metropolitan Stock Exchange Limited. It is also registered as a Depository Participant with
CDSL and Portfolio Manager with SEBI. It also has registration with AMFI as a Mutual Fund Distributor. Angel Broking Private Limited is a
registered entity with SEBI for Research Analyst in terms of SEBI (Research Analyst) Regulations, 2014 vide registration number
INH000000164. Angel or its associates has not been debarred/ suspended by SEBI or any other regulatory authority for accessing
/dealing in securities Market. Angel or its associates/analyst has not received any compensation / managed or
co-managed public offering of securities of the company covered by Analyst during the past twelve months.
This document is solely for the personal information of the recipient, and must not be singularly used as the basis of any investment
decision. Nothing in this document should be construed as investment or financial advice. Each recipient of this document should make
such investigations as they deem necessary to arrive at an independent evaluation of an investment in the securities of the companies
referred to in this document (including the merits and risks involved), and should consult their own advisors to determine the merits and
risks of such an investment.
Reports based on technical and derivative analysis center on studying charts of a stock's price movement, outstanding positions and
trading volume, as opposed to focusing on a company's fundamentals and, as such, may not match with a report on a company's
fundamentals. Investors are advised to refer the Fundamental and Technical Research Reports available on our website to evaluate the
contrary view, if any.
The information in this document has been printed on the basis of publicly available information, internal data and other reliable
sources believed to be true, but we do not represent that it is accurate or complete and it should not be relied on as such, as this
document is for general guidance only. Angel Broking Pvt. Limited or any of its affiliates/ group companies shall not be in any way
responsible for any loss or damage that may arise to any person from any inadvertent error in the information contained in this report.
Angel Broking Pvt. Limited has not independently verified all the information contained within this document. Accordingly, we cannot
testify, nor make any representation or warranty, express or implied, to the accuracy, contents or data contained within this document.
While Angel Broking Pvt. Limited endeavors to update on a reasonable basis the information discussed in this material, there may be
regulatory, compliance, or other reasons that prevent us from doing so.
This document is being supplied to you solely for your information, and its contents, information or data may not be reproduced,
redistributed or passed on, directly or indirectly.
Neither Angel Broking Pvt. Limited, nor its directors, employees or affiliates shall be liable for any loss or damage that may arise from
or in connection with the use of this information.